Hi! My name is Simone and I am from Germany.
I study computer science and I am interested in astronomy.
This is a two-dimensional simulation of our solar system to scale, written in Javascript while using the Keplerian Elements for calculating the positions. It shows real-time planetary movement at the current date or a manually set date. It is possible to change the scale of the planets and the sun. Clicking on a planet reveals further information including the velocity, mass, distance from the sun and much more. The plotting is done with p5.js. The way the positions are calculated is explained on the GitHub readMe.
This is a scientific calculator using the Shunting-Yard-Algorithm to transform the infix expression (7 * 2) to postfix (7 2 *). It includes binary Operations (+, -, *, /, ^) and unary Operations (sin, cos, tan, √, log, ln). It is also possible to switch between radians and degrees. The way the Shunting-Yard-Algorithm works is explained on the GitHub readMe.
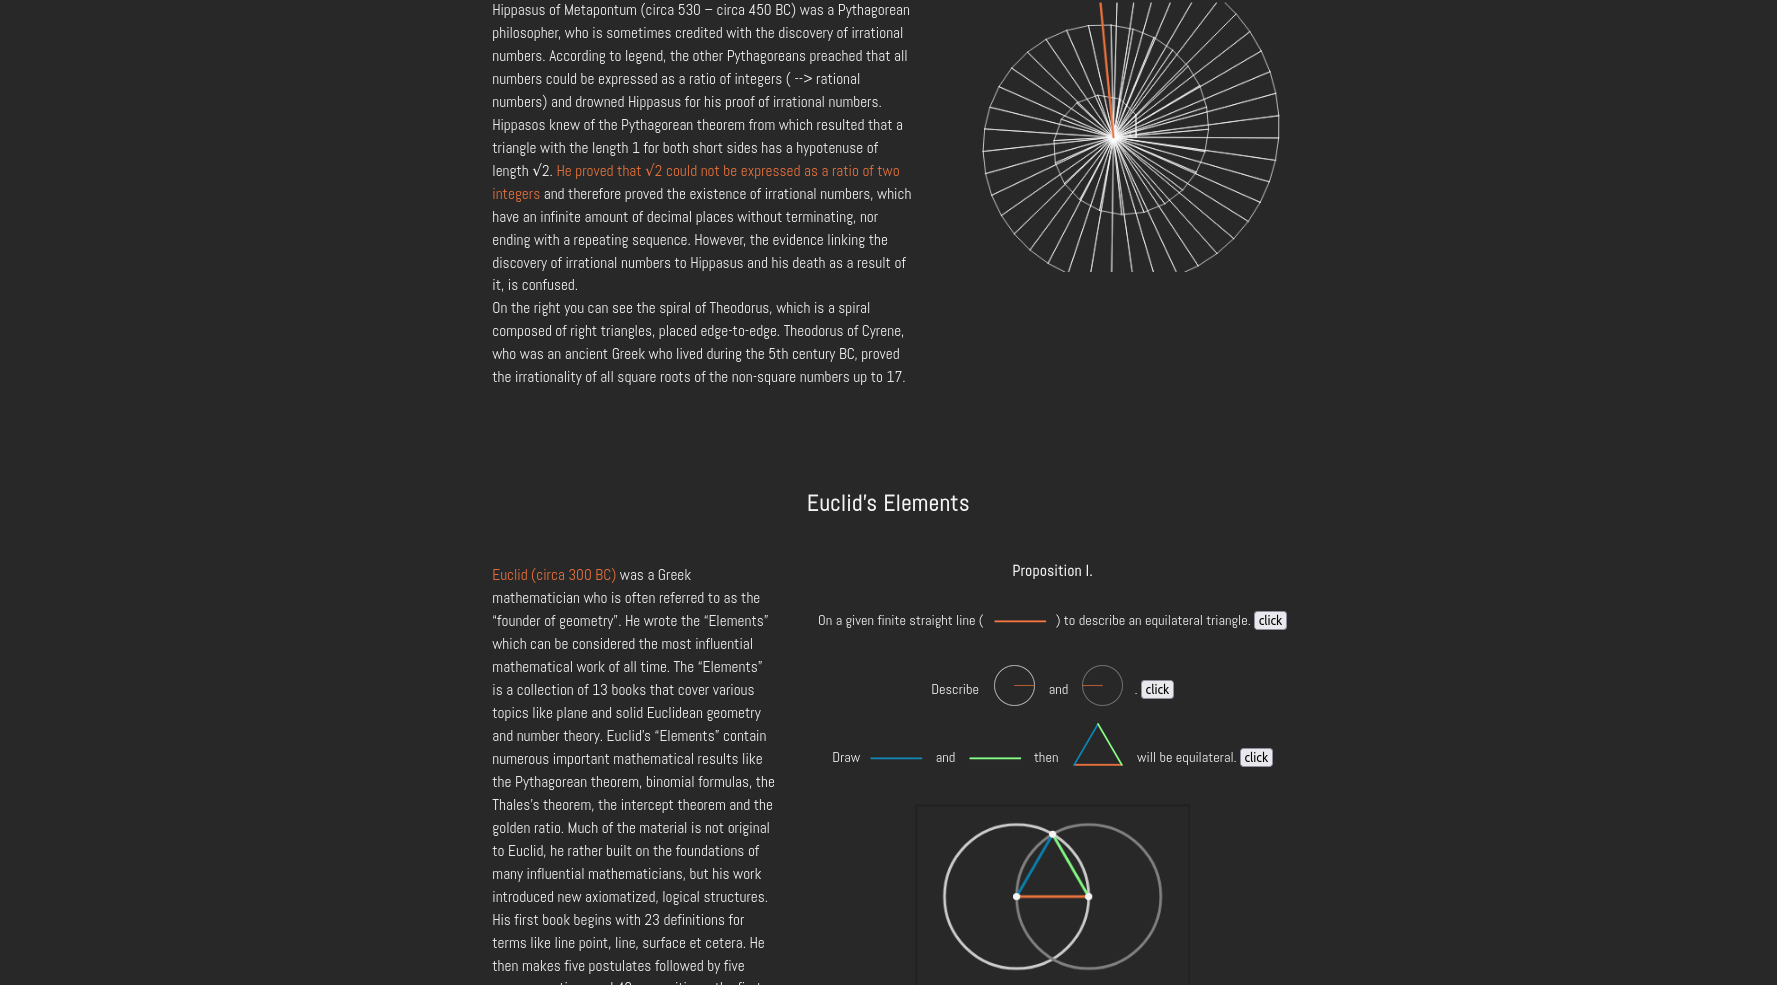
An interactive website about the history of mathematics. This website was made for the Summer of Math Exposition (SoME1), which is a competition by the youtubers 3Blue1Brown and LeiosOS. It includes a simulation of the babylonian numeral system, the ancient egyptian multiplication, the Pythagorean theorem, the spiral of Theodorus , Euclid's elements and the sieve of Erathostenes.
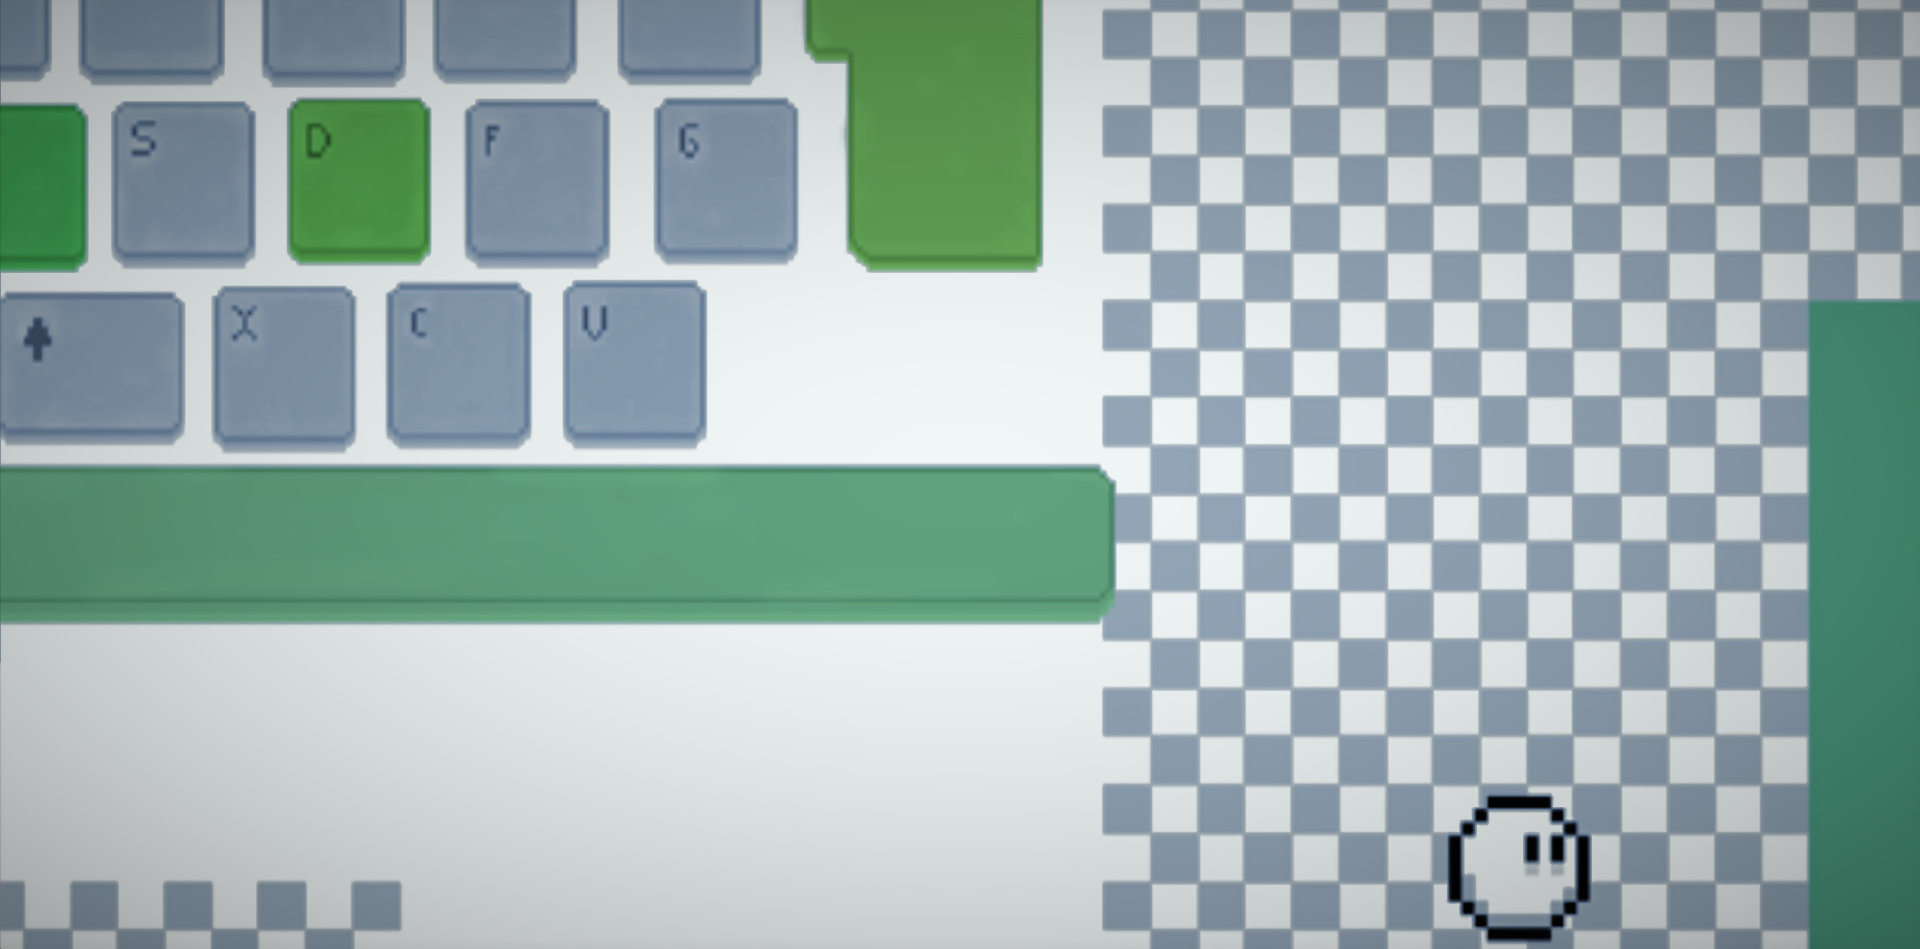
A Game, created in Ludum Dare 45 in 48 hours, about a ball trying to get control. Created with Unity and C#. In NoControl you have to get your control back by finding the keys of your keyboard.
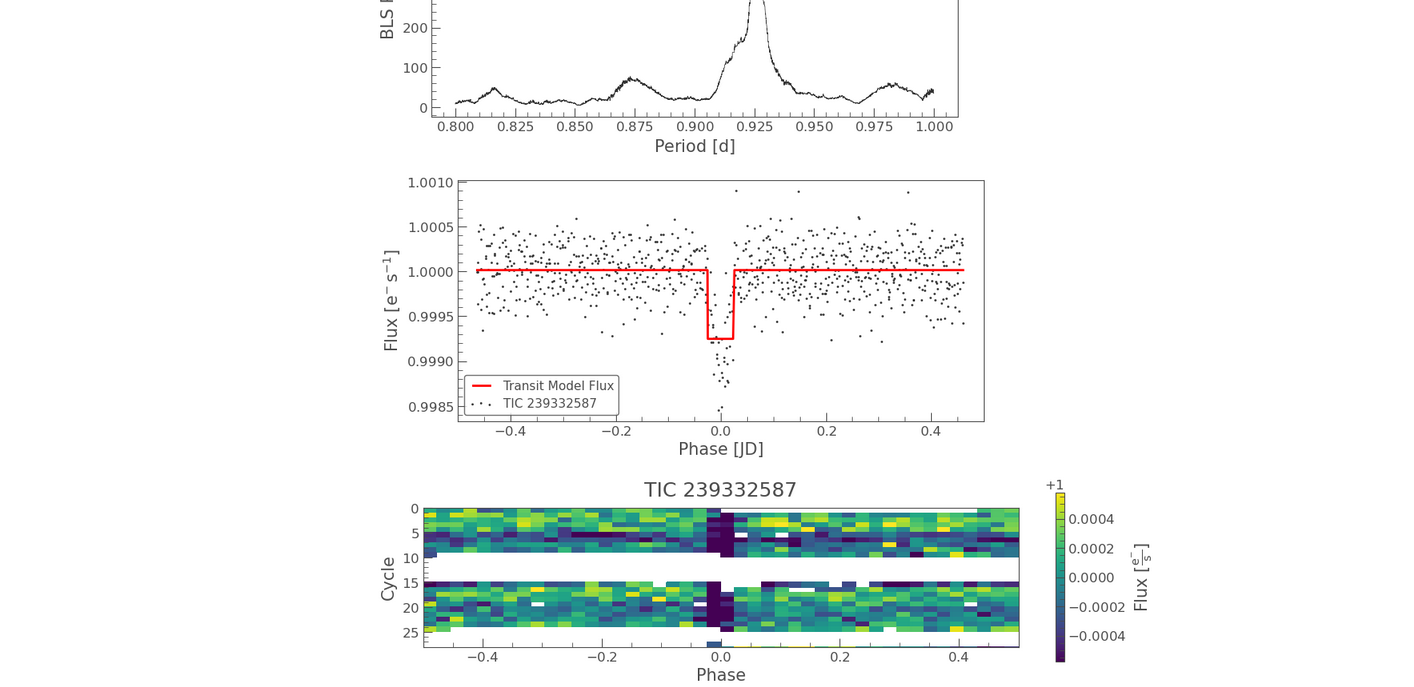
Using the python package lightkurve and TESS data together with jupyter notebook I analyzed the lightcurve of the star TIC-239332587 and discovered dips in brightness that indicate a planet, which to my knowledge is not listed in any Exoplanet archive. The approximated orbital radius indicates that the planet is very close to the sun and not in the circumstellar habitable zone.
A sorting algorithm visualization that includes Bubblesort, Selectionsort, Insertionsort and Quicksort aswell as the possiblility to change the sorting speed and number of elements in the array. Each elements value is represented by the size of the bar, the algorithm sorts them by placing the smallest elements on the left and the biggest elements on the right. The plotting is done with p5.js.